Determination of the Formula of an Iron-Phenanthroline Complex and Comparison of Ligand Strengths
Essay by dereckshan1996 • September 15, 2015 • Lab Report • 883 Words (4 Pages) • 1,386 Views
Essay Preview: Determination of the Formula of an Iron-Phenanthroline Complex and Comparison of Ligand Strengths
Determination of the Formula of an Iron-Phenanthroline Complex and Comparison of Ligand Strengths
Ha Thi Thu Le
CHEM 225
Submitted: April 20, 2015
Introduction
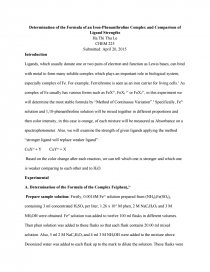
Ligands, which usually donate one or two pairs of electron and function as Lewis bases, can bind with metal to form many soluble complex which plays an important role in biological system, especially complex of Fe. For example, Ferrichrome is seen as an iron carrier for living cells.1 As complex of Fe usually has various forms such as FeX2+, FeX2 2+ or FeX32+, in this experiment we will determine the most stable formula by “Method of Continuous Variation”.2 Specifically, Fe2+ solution and 1,10-phenanthroline solution will be mixed together in different proportions and then color intensity, in this case is orange, of each mixture will be measured as Absorbance on a spectrophotometer. Also, we will examine the strength of given ligands applying the method “stronger ligand will replace weaker ligand”:
CuX2+ + Y CuY2+ + X
Based on the color change after each reaction, we can tell which one is stronger and which one is weaker comparing to each other and to H2O.
Experimental
A. Determination of the Formula of the Complex Fe(phen)n2+
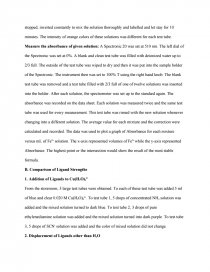
Prepare sample solution: Firstly, 0.0014M Fe2+ solution prepared from (NH4)2Fe(SO4)2 containing 3 ml concentrated H2SO4 per liter, 1.26 x 10⁻³ M phen, 2 M NaC2H3O2 and 3 M NH2OH were obtained. Fe2+ solution was added to twelve 100 ml flasks in different volumes. Then phen solution was added to these flasks so that each flask contains 20.00 ml mixed solution. Also, 5 ml 2 M NaC2H3O2 and 4 ml 3 M NH2OH were added to the mixture above. Deionized water was added to each flask up to the mark to dilute the solution. These flasks were stopped, inverted constantly to mix the solution thoroughly and labelled and let stay for 10 minutes. The intensity of orange colors of these solutions was different for each test tube.
Measure the absorbance of given solution: A Spectronic 20 was set at 510 nm. The left dial of the Spectronic was set at 0%. A blank and clean test tube was filled with deionized water up to 2/3 full. The outside of the test tube was wiped to dry and then it was put into the sample holder of the Spectronic. The instrument then was set to 100% T using the right hand knob. The blank test tube was removed and a test tube filled with 2/3 full of one of twelve solutions was inserted into the holder. After each solution, the spectrometer was set up to the standard again. The absorbance was recorded on the data sheet. Each solution was measured twice and the same test tube was used for every measurement. This test tube was rinsed with the new solution whenever changing into a different solution. The average value for each mixture and the correction were calculated and recorded. The data was used to plot a graph of Absorbance for each mixture versus mL of Fe2+ solution. The x-axis represented volumes of Fe2+ while the y-axis represented Absorbance. The highest point or the intersection would show the result of the most stable formula.
B. Comparison of Ligand Strengths
1. Addition of Ligands to Cu(H2O)62+
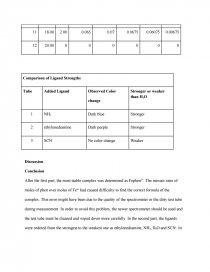
From the storeroom, 3 large test tubes were obtained. To each of these test tube was added 5 ml of blue and clear 0.020 M Cu(H2O)62+. To test tube 1, 5 drops of concentrated NH3 solution was added and the mixed solution turned to dark blue. To test tube 2, 3 drops of pure ethylenediamine solution was added and the mixed solution turned into dark purple. To test tube 3, 5 drops of SCN- solution was added and the color of mixed solution did not change.
2. Displacement of Ligands other than H2O
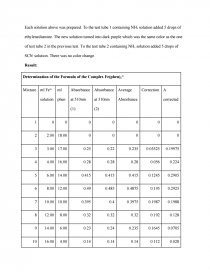
Each solution above was prepared. To the test tube 1 containing NH3 solution added 5 drops of ethylenediamine. The new solution turned into dark purple which was the same color as the one of test tube 2 in the previous test. To the test tube 2 containing NH3 solution added 5 drops of SCN- solution. There was no color change.
Result:
Determination of the Formula of the Complex Fe(phen)n2+ | |||||||
Mixture | ml Fe2+ solution | ml phen | Absorbance at 510nm (1) | Absorbance at 510nm (2) | Average Absorbance | Correction | A corrected |
1 | 0 | 0 | 0 | 0 | 0 | 0 | 0 |
2 | 2.00 | 18.00 | 0 | 0 | 0 | 0 | 0 |
3 | 3.00 | 17.00 | 0.25 | 0.22 | 0.235 | 0.03525 | 0.19975 |
4 | 4.00 | 16.00 | 0.28 | 0.28 | 0.28 | 0.056 | 0.224 |
5 | 6.00 | 14.00 | 0.415 | 0.415 | 0.415 | 0.1245 | 0.2905 |
6 | 8.00 | 12.00 | 0.49 | 0.485 | 0.4875 | 0.195 | 0.2925 |
7 | 10.00 | 10.00 | 0.395 | 0.4 | 0.3975 | 0.1987 | 0.1988 |
8 | 12.00 | 8.00 | 0.32 | 0.32 | 0.32 | 0.192 | 0.128 |
9 | 14.00 | 6.00 | 0.23 | 0.24 | 0.235 | 0.1645 | 0.0705 |
10 | 16.00 | 4.00 | 0.14 | 0.14 | 0.14 | 0.112 | 0.028 |
11 | 18.00 | 2.00 | 0.065 | 0.07 | 0.0675 | 0.06075 | 0.00675 |
12 | 20.00 | 0 | 0 | 0 | 0 | 0 | 0 |
...
...
